


Network traffic has always been one of the richest sources of truth in cybersecurity. Every packet has its own story, whether it is a harmless web request, a misconfigured service, or a stealthy connection to a command-and-control server.
For an analyst, this is both a blessing and a burden. The sheer volume of traffic, combined with its diversity and complexity, makes it difficult to separate what matters from what doesn’t. Technically, it’s like trying to find a single meaningful conversation in the roar of a stadium crowd.
To overcome this challenge at scale, modern security operations can no longer rely solely on manual analysis. This reality is driving a necessary shift toward automated pipelines, where raw traffic can be transformed into structured intelligence that other systems can consume. Behind this shift lies the need for a reliable “translator engine” that can operate in the background.
In this proof of concept, we combined SLIPS (Stratosphere Linux IPS) with the STIX (Structured Threat Information Expression) standard. SLIPS processes packet captures (PCAPs) to generate alerts and indicators of compromise (IoCs). We then convert those IoCs into STIX format and visualize them, revealing the relationships between malware, IP addresses, domains, file hashes, and behaviors. This workflow helps us:
- Identify attack patterns faster than by reviewing logs manually.
- Share threat intelligence in a consistent, standardized format.
- Communicate complex attack scenarios in a clear, visual way.
Workflow Overview
We structured the workflow into three main steps:
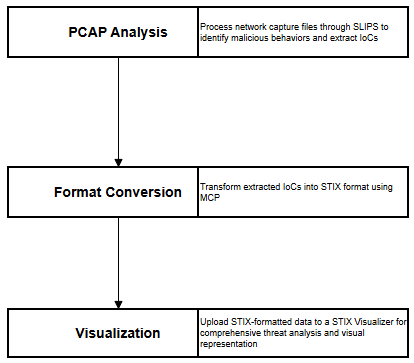
- PCAP Analysis: We begin by processing network capture files through SLIPS (Stratosphere Linux IPS) to identify malicious behaviors and extract Indicators of Compromise (IoCs)
- Format Conversion: The extracted IoCs are then transformed into STIX (Structured Threat Information eXpression) format using MCP (MISP Core Protocol)
- Visualization: Finally, we upload the STIX-formatted data to a STIX Visualizer platform for comprehensive threat analysis and visual representation
PCAP and SLIPS Analysis
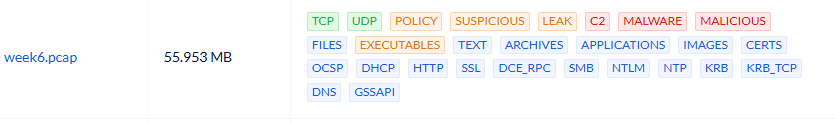
The PCAP file used in this study case was captured on December 7, 2018. It records traffic between an internal host (172.16.2.201) and various external servers, including communication consistent with Trickbot malware.
We analyzed the traffic with SLIPS using several enabled modules, such as ARP, HTTP Analyzer, Threat Intelligence, Timeline, and VirusTotal integration. SLIPS produced structured alerts that highlighted key findings:
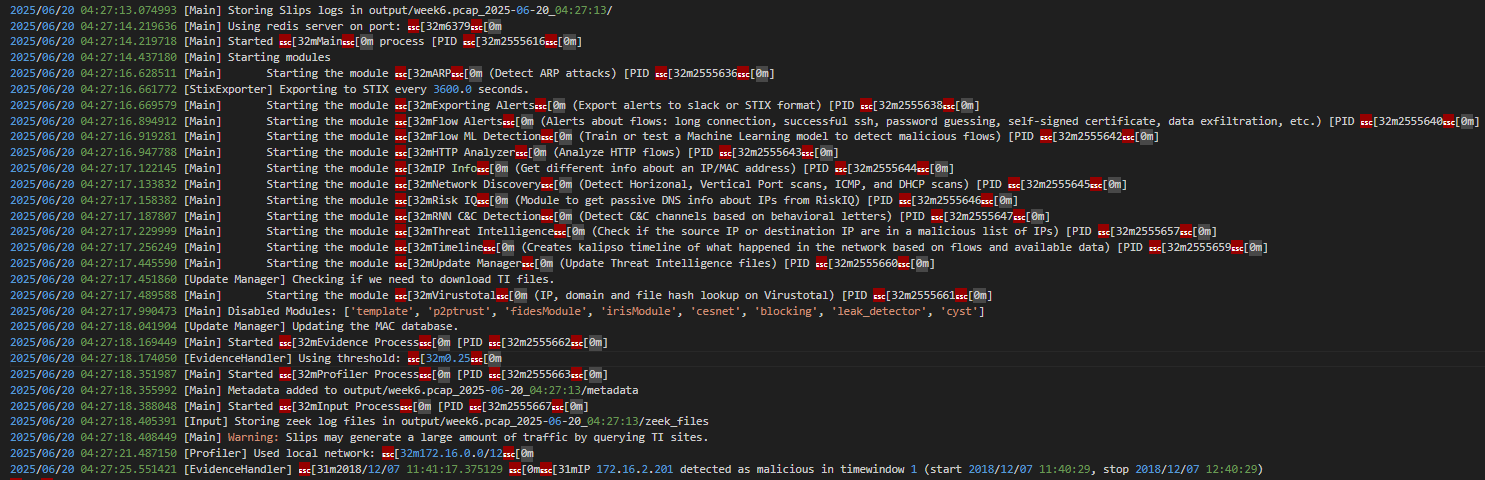
- Malicious JA3 Fingerprints – For example, hash 6734f37431670b3ab4292b8f60f29984, associated with Trickbot, seen in traffic from 172.16.2.201 to 105.27.171.234 and 185.251.38.65.
- Suspicious Connections – Repeated traffic between the infected host and private IPs (172.16.2.4, 172.16.2.255) on ports including 53, 445, and 49155.
- Executable Downloads – Files of type application/x-dosexec downloaded from servers like 69.28.199.10 and 145.239.25.101.
- Unencrypted HTTP Traffic – Cleartext connections to domains such as myexternalip.com and icanhazip.com.
- Suspicious DNS Responses – Invalid responses resolving to 127.0.0.2.
These results illustrate how SLIPS can extract meaningful signals from noisy network traffic.
Indicators of Compromise (IoCs)
To simplify analysis, we extracted IoCs from SLIPS alerts and organized them into categories. In which IoCs provided in order to show the clearest evidence of malicious activity.

Why STIX?
At this stage, we could store IoCs in raw JSON. However, JSON logs are usually specific to a tool and lack a universal schema. In contrast, STIX provides a standardized way to represent cyber threat intelligence. Every STIX bundle contains structured objects (indicators, malware, threat actors, attack patterns, relationships) that can be processed, shared, and visualized consistently.
This makes STIX essential for:
- Compatibility with visualizers and SIEMs.
- Integration with SOAR platforms and AI-driven analysis.
- Consistent enrichment and correlation across multiple datasets.
STIX MCP Server Implementation
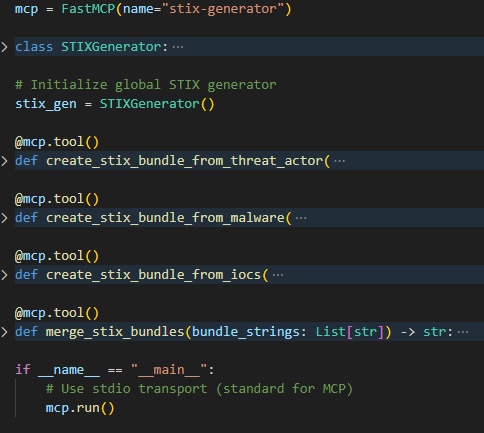
To generate STIX bundles, we built a server using FastMCP, which handles inter-process communication. The server exposes tools that create STIX objects, such as:
- Identity – Represents an organization (e.g., CISA).
- Threat Actor – Describes adversaries or groups.
- Malware – Captures malware families or samples.
- Indicator – Represents observable patterns like hashes, IPs, and domains.
- Attack Pattern – Encodes techniques such as lateral movement.
- Relationship – Connects indicators to malware or attack patterns.
Each object follows the STIX specification, ensuring interoperability with other CTI tools.
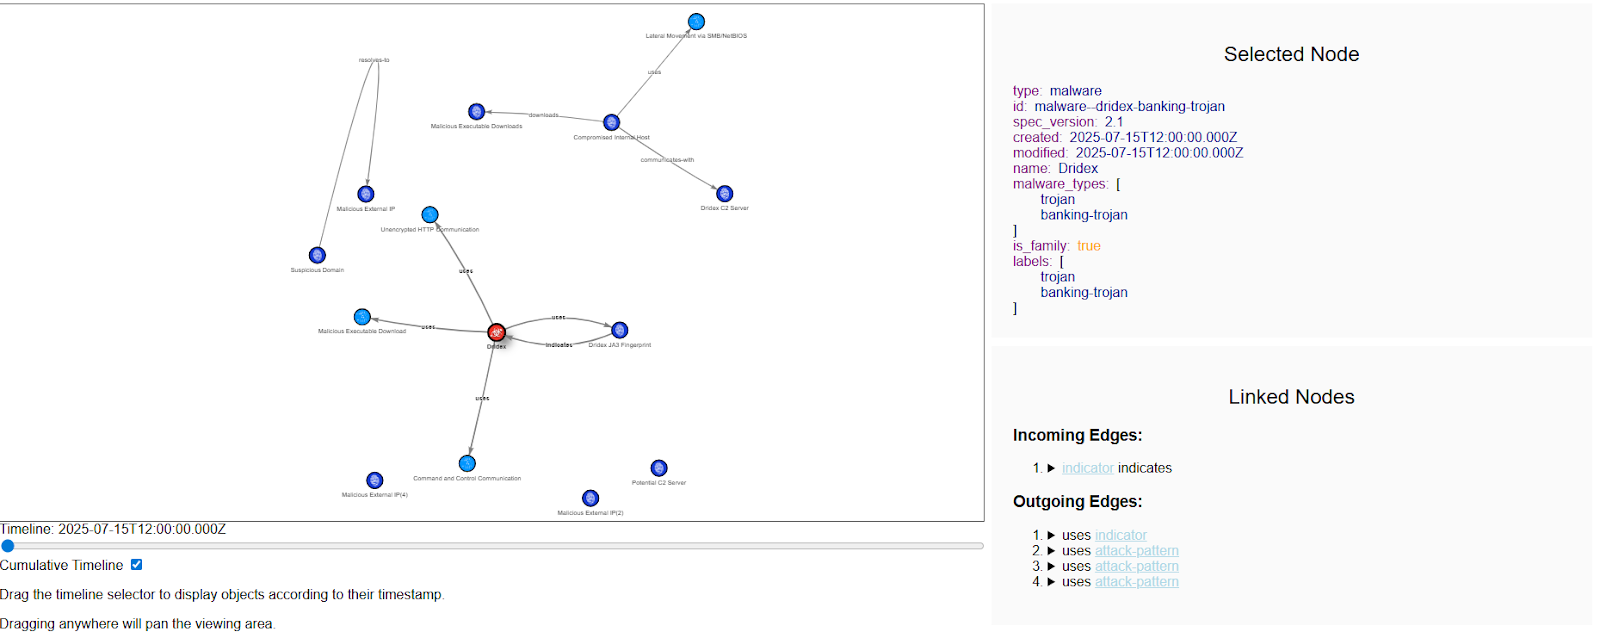
Visualization Results
When we visualize the STIX bundle, the results are clear. The central red node represents the malware (Trickbot). Surrounding it are blue nodes for malicious IPs, domains, URLs, and hashes. Lines connect these objects, showing their relationships. For example:
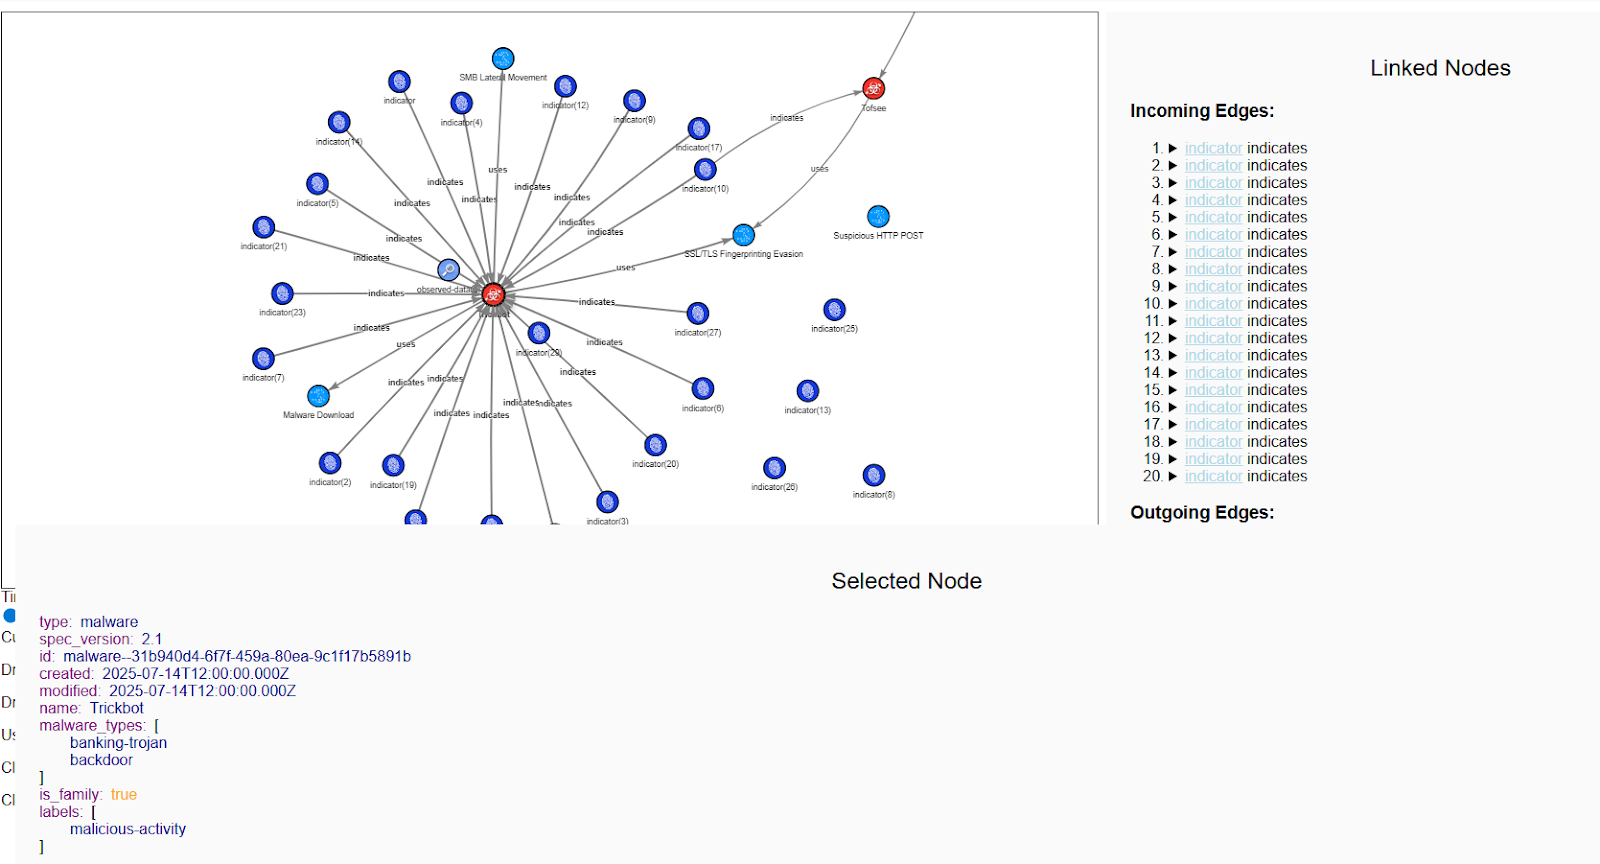
- The malware is linked to IPs that hosted payloads.
- File hashes connect to executable downloads.
- Attack patterns highlight behaviors such as lateral movement.
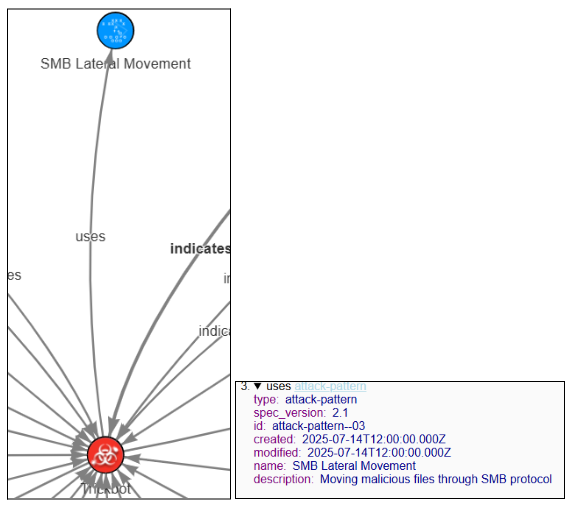
We validated the visualization by cross-checking raw Zeek logs, which confirmed suspicious SMB file transfers of executables inside the network.
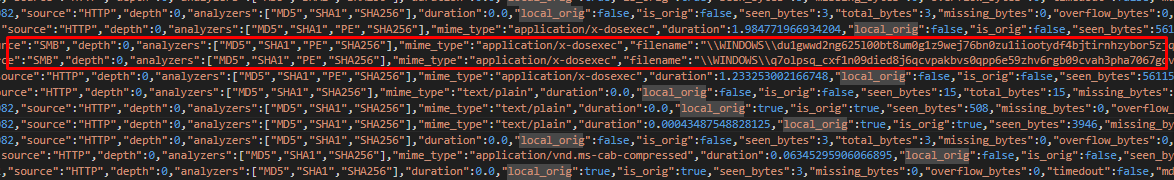
This graphical representation makes it easier to understand not just what happened, but also how the attack unfolded.
Here is another visualization from various PCAP and attacks:
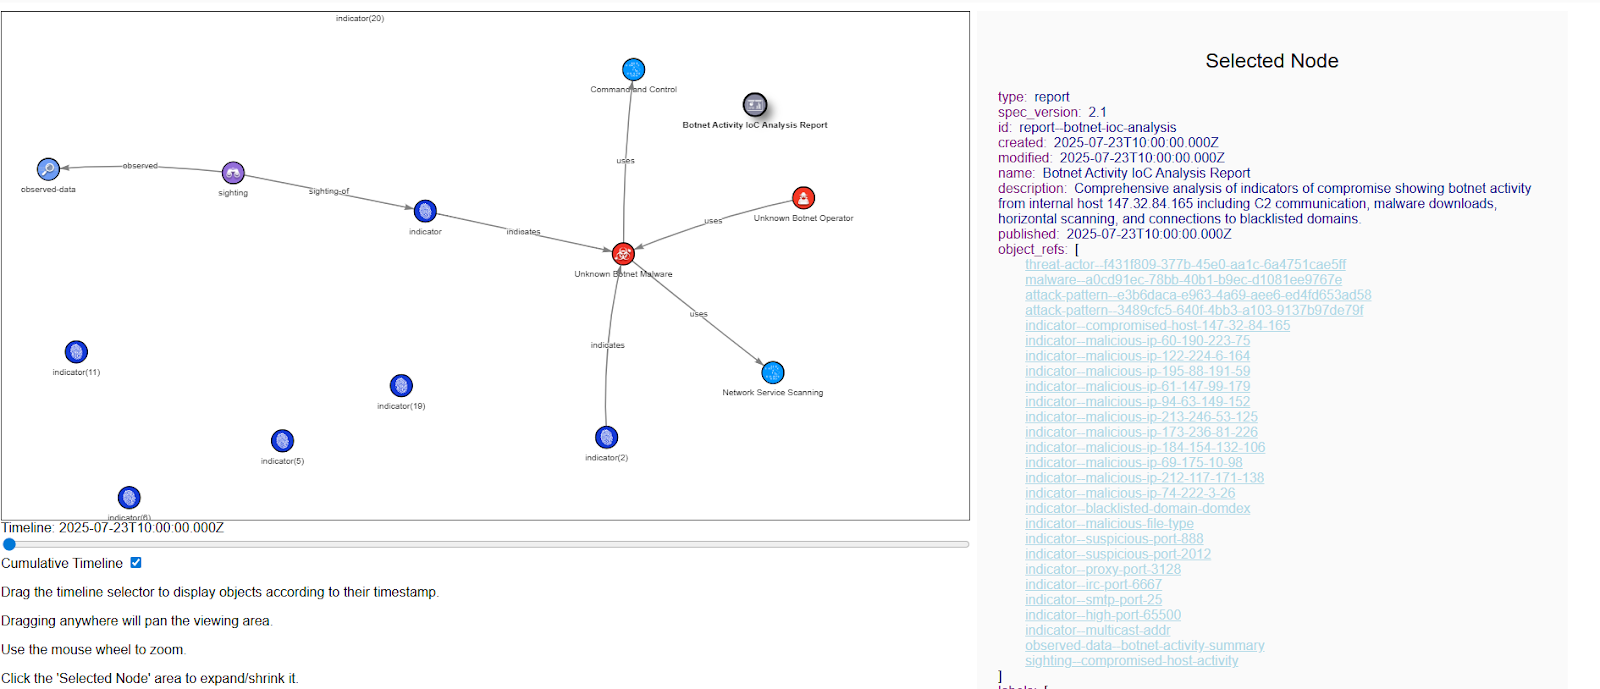
This proof of concept shows how we can transform raw PCAP data into meaningful, visual intelligence. By using SLIPS to detect threats, converting alerts into STIX, and then visualizing the data, we created a structured view of the Trickbot attack and related IoCs.
As attacks grow more sophisticated, workflows like this (combining detection, standardization, and visualization) can improves understanding, supports faster decisions, and strengthens responses to attacks.